



June 2026 London Real Estate Market Update
Sales Hold Steady While Market Conditions Continue to Evolve
The London and St. Thomas real estate market remained relatively stable through June, with 753 homes selling through the MLS®, a 1.6% increase over June 2025 and in line with sales activity over the past four years. While the numbers suggest a market that continues to move at a measured pace, the headline statistics don’t tell the entire story.
Inventory remained at 4.6 months of supply, and the sales-to-new listings ratio finished at 41.6%, just below the range the Canadian Real Estate Association considers balanced. On paper, the market appears steady. However, when we look beyond traditional metrics, a more nuanced picture begins to emerge.
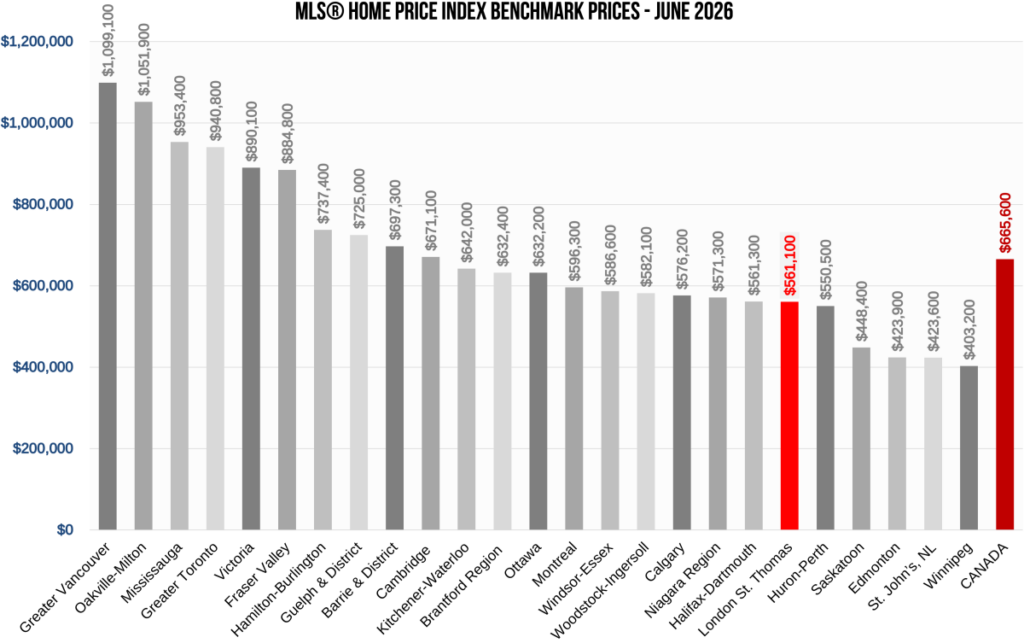
Average Prices Across Canada

A Closer Look at the June Market
The average sale price across the LSTAR region was $606,614 in June. That’s down from $662,292 in May and below June 2025, though monthly average prices can fluctuate significantly depending on the types of homes that sell in any given month.
Benchmark pricing, which measures the value of a typical home and removes much of the distortion caused by luxury or entry-level sales, also softened slightly.
The LSTAR Composite Benchmark Price now sits at $561,100, representing:
- ↓1.6% compared to May 2026
- ↓0.3% compared to March 2026
While benchmark prices have eased modestly over the past several months, they continue to reflect a market that is largely stable rather than one experiencing significant price declines.
Market Balance
The June Sales-to-New Listings Ratio (SNLR) was 41.6%, nearly identical to May’s 42.8%.
Traditionally, a ratio between 45% and 65% is considered a balanced market. While we’re slightly below that range, buyers continue to enjoy more choice than they did during the pandemic years, and sellers who price their homes appropriately are still finding success.
This remains a market where preparation, pricing, and presentation matter more than ever.

Looking Beyond the Headlines
One statistic that deserves additional discussion is the reported 4.6 months of inventory.
Months of inventory is calculated by dividing the number of active listings by the current sales pace. It is a useful measure of market balance, but, like any statistic, it should be interpreted in the broader context.
During June:
- 775 listings reduced their asking price
- 372 listings expired
- 867 listings were terminated or removed from the market
Combined, that’s more than 2,000 listings that experienced a significant change during the month.
While price reductions show that many sellers are adapting to today’s market conditions, the large number of expired and terminated listings also suggests that some homeowners are stepping back rather than continuing to market their property.
This raises an important consideration.
If a substantial number of homes are being withdrawn from the market, it naturally affects the available inventory used to calculate months of supply. While the reported figure of 4.6 months of inventory is accurate according to industry methodology, it’s worth recognizing that inventory levels are affected not only by sales activity but also by the number of properties leaving the market altogether.
Rather than relying on a single statistic, it’s important to consider pricing trends, listing activity, inventory, buyer demand, and market behaviour collectively before drawing conclusions about the health of the market.
Elevate Insight
“The June numbers suggest a market that’s becoming more balanced, but it’s important to look beyond the headline statistics. Price reductions, expired listings, and terminated listings each tell part of the story. Real estate markets are dynamic, and understanding what’s happening requires more than looking at a single number. That’s why local knowledge and context remain so important when making buying or selling decisions.”
— Elevate Real Estate Group
Benchmark Prices by Area
| Area | Benchmark Price | Average Sale Price |
| Central Elgin | $649,700 | $610,187 |
| London East | $433,900 | $455,100 |
| London North | $623,600 | $700,372 |
| London South | $559,700 | $602,313 |
| Middlesex Centre | $782,000 | $963,376 |
| St. Thomas | $515,200 | $524,184 |
| Strathroy-Caradoc | $725,500 | $649,806 |
| LSTAR Overall | $561,100 | $606,614 |
Benchmark Price Trends by Property Type
| Property Type | June Benchmark | Monthly Change |
| Composite | $561,100 | ↓1.6% |
| Single Family | $613,800 | ↓1.6% |
| One Storey | $548,600 | ↓2.7% |
| Two Storey | $666,300 | ↓0.9% |
| Townhouse | $432,900 | ↓1.4% |
| Apartment | $324,100 | ↓5.2% |
What This Means for Buyers
Today’s market continues to offer buyers more opportunities than we’ve seen in several years.
With increased inventory, more price adjustments, and homes generally taking longer to sell than in the peak market, buyers often have more time to complete inspections, review financing, and make informed decisions.
That doesn’t mean every property is negotiable or every listing is overpriced. Well-presented homes that are priced appropriately continue to attract strong interest.
What This Means for Sellers
The June numbers reinforce a trend we’ve been discussing throughout the year.
Today’s buyers are informed, patient, and have more choice.
Homes that are accurately priced, professionally marketed, and properly prepared continue to sell. Properties that enter the market above comparable value often require price reductions or remain on the market significantly longer.
Preparation has become one of the strongest competitive advantages a seller can have.
Final Thoughts
The June market reflects continued stability across London, St. Thomas, and the surrounding communities. Sales remain steady, inventory has stabilized, and buyers continue to enjoy more choice than in recent years.
At the same time, the growing number of price reductions, expired listings, and terminated listings reminds us that interpreting market conditions requires looking beyond a single headline statistic. Every neighbourhood, price range, and property type behaves differently.
Whether you’re thinking about buying, selling, or simply trying to understand what today’s market means for your own home, local expertise matters.
At Elevate Real Estate Group, we’re always happy to provide honest advice, explain the numbers in plain language, and help you make confident decisions—without pressure.


Let’s Start Your Home Search
🏡 Browse the latest London and area MLS® listings here and explore homes by neighbourhood, price range, property type, and more.
Access Our FREE Monthly Market Updates
👉 Sign up for our monthly market newsletter
More From The Elevate Team
When is the right time to buy?
There May Never Be a “Perfect” Time to Buy a Home… And That’s Okay.
Find My Dream Home

First Time Buyer Guide
First-time home buyers’ guide to buying a home

Home Buyers Guide
How can we help you find a home?

The Best Neighbourhoods in London, Ontario
Where to live? Take a look at this list of great neighbourhoods.

The Best Schools in London, Ontario
Schools matter. Where should you send your kids?


